Use the Table Palette
Overview
The Table palette is one of the key features of Simplebim. It allows you to hide the complexity of BIM by organizing and analyzing the data in your models as a table. With the Table palette you basically have a simple, familiar table that is connected to the 3D model. When you combine this feature with the idea of normalization (the same data is always in the same place, is reliable and structured in the same way) you have something very powerful in your hands!
The Table palette can have many tabs, just like Excel. This means that you can create any number of views to the model based on your specific needs. You could for example have a view (=tab) for pre-cast elements, concrete pours, spaces, interior works – you name it. You can also rename the tabs by right-clicking on the tab and selecting “Rename” or give the tabs a color.
When you have created a great view you can easily duplicate it by right-clicking on the tab and selecting “Duplicate Tab”. This way you can preserve your original view when you want to make slight modifications for a specific purpose.
When your models are normalized you can easily re-use the views you create with all of your models.
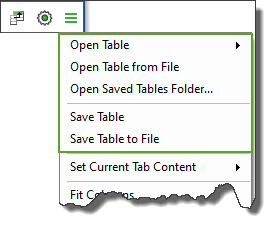
When you have defined your view(s) you simple save the table either for your own use or for sharing it with others (save to file). Then you import another model and open the saved table – and your table is populated with the data from your new model.
When you use the Table palette there are 3 things you need to define. These are all described in more detail below.
- Data: which objects or object groups do you want to see in your table?
- Layout: which properties of the selected objects or object groups do you want to see, in which order and how do you want to group them?
- Features: which features do you want to use, do you for example want to colorize the 3D model based on the data in your table?
But this is not all. The Table palette is not just for viewing and analyzing data inside Simplebim. You can also export the whole table or just the selected view (=tab) to the clipboard, to Excel, to PDF or print it. You can even create a Bimsheet from your Table -palette and use the familiar Excel user interface for editing your data right inside Simplebim.
Data
The first step is to select which data you want to show in the Table palette. The Table palette can show either the properties of objects or the properties of groups.
You can clear all data from the table by selecting “Clear Current Tab” or “Clear All Tabs” from the menu, or you can simply close the tabs.
All objects from a object class
- Drag and drop an object class from the Objects palette into the Table palette
- Select “Set Current Tab Content” from the menu, then “Object Class” and finally the object class you want to use.
Manual selection of objects
- Drag and drop objects from the 3D Palette or property values from the Properties palette into the Table palette.
- You can drop objects from the same object class or objects from different object classes.
- Drop without modifier keys to set the content of the Table palette
- Hold down Ctrl while you drop to add objects to the Table palette
- Hold down Alt while you drop to remove objects to the Table palette
Type objects
- Select “Set Current Tab Content” from the menu, then “Type Objects” and finally the object class for which you want to see the type objects.
- The Table palette will show the properties of the selected type objects.
Objects in a group
- If your model contains object groups (for example systems and zones) you can drag and drop a group from the Objects palette into the Table palette
- The Table palette will show all objects that belong to the dropped group
Object groups
- Select multiple groups from the Objects palette (hold down Shift) and drag and drop them into the Table palette.
- The table palette will show the properties of the dropped groups, not the properties of the objects in the dropped groups
Object group category
- Select “Set Current Tab Content” from the menu, then “Object Groups” and finally the group category for which you want to see groups.
- The Table palette will show the properties of the selected groups.
Layout
The layout of the Table palette defines the following
- Order of columns = properties. You can drag and drop the column headers to re-arrange them as you wish
- Width of columns. You can re-size the columns by dragging the vertical border of a column header
- Visibility of columns. You can hide columns by dragging a column header outside the table or by un-checking the column in the Field Chooser dialog that opens from the button in the upper left hand corner of the Table palette. In the Field Chooser dialog you can also show hidden columns by checking a hidden column.
- Column summaries. You can set numeric columns to show one or more summaries by clicking on the Summary icon in the column header. You can set a summery for average, count, maximum, minimum and sum.
- Column filters. You can set a filter for each column that filters which rows are shown in the table. This is done in the Filter Row that is shown below the column headers. The filter options vary based on the data type of the column, e.g. string or numeric.
- Column fixing. You can fix columns to the left edge of the table preventing them from scrolling out of view by clicking the Pin icon in the column header
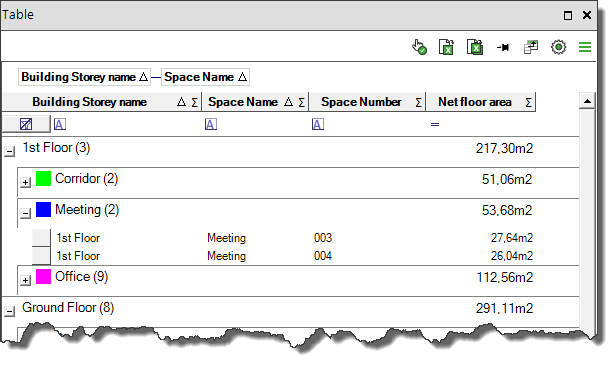
- Group by. You can group the table using one or more columns by dragging a column header into the group by box in the upper left hand corner of the table. You can re-arrange the order of the group by columns by dragging them inside the group by box. To remove a group by column, drag it outside the group by box.
You can clear the layout of the table by selecting “Reset Current Tab Layout” from the menu.
Features
The features define how the table behaves when you are populating it with data or when you have already populated it. You set the features using the menu that opens when you click the gear -icon in the toolbar of the Table palette.
- Keep table layout
- On = when you show new data in the table it keeps the previous layout you have defined
- Off = when you show new data in the table changes its layout to reflect the new data you are showing
- Lock table layout
- On = the layout (except for column filters) of the table cannot be changed by the user
- Off = the layout of the table can be edited normally
- Colorize groups. This feature only applies when your layout has group by columns.
- On = objects in the model are colorized in 3D based on a pre-defined color scheme. The same colors are also shown in the table on each group by row.
- Off = objects in the model are not colorized, i.e. they use their normal colors.
- Show only common properties. This feature is only applicable when the table is showing objects from multiple object classes.
- On = the table shows only the properties that are common to all shown objects.
- Off = the table shows all properties from all shown objects.
- Speak
- On = the rows you select in the table are automatically spoken as you make the selections
- Off = the rows you select in the table are not spoken